BHP vs WHP: Key Differences Explained Simply
If you’ve ever stared at a spec sheet wondering what is BHP vs WHP, you’re not alone. The confusion stems from where the power is measured, not just how much there is. One number reflects raw engine output.

The other shows what actually hits the pavement.
Understanding this gap changes how you view performance claims. Manufacturer data often cites brake horsepower, which ignores drivetrain friction. As of 2026, SAE J1349 standards still define these testing protocols strictly.
Let’s break down why those two lines on a dyno graph rarely match up.
Why You Can’t Trust the Spec Sheet Alone
Marketing teams love big numbers. They quote gross or brake horsepower because it looks impressive on paper. But that figure doesn’t account for energy lost in gears and bearings.
Your car feels slower than the brochure suggests because of this discrepancy.
Think of BHP as the effort your muscles generate. Think of WHP as the weight you actually lift after accounting for bad form and friction. The difference is real and measurable.
Ignoring it leads to unrealistic expectations about acceleration.
You need to know which metric applies to your situation. Are you building an engine? Focus on BHP.
Are you tuning for track times? Watch the WHP. Mixing them up causes wasted money on parts that don’t deliver expected gains.
Reading the Dyno Graph: The Visual Gap Between Crank and Wheel
A dynamometer printout tells the true story through two distinct curves. The upper line represents Brake Horsepower at the crankshaft. The lower line shows Wheel Horsepower at the tires.
The space between them is pure loss.
Visualizing this gap helps you spot mechanical issues quickly. A wide separation indicates excessive friction or binding components. A narrow gap means efficient power transfer.
Look at the shape of both lines together.
They should mirror each other closely. If the WHP curve drops off sharply while BHP stays high, something is slipping. That could be a worn clutch or failing differential.
Always check if the peaks align vertically. Misalignment suggests timing or calibration errors during the test.

Calculating Drivetrain Losses by Vehicle Type
Not all cars lose power equally. The configuration dictates the percentage drop from crank to wheel. Front-wheel-drive setups typically see smaller losses due to fewer moving parts.
Rear-wheel-drive vehicles have longer driveshafts, adding more friction points.
All-wheel-drive systems suffer the most significant penalties. Extra differentials and half-shafts consume considerable energy. Here is a typical breakdown based on aggregate industry data:
| Drive Configuration | Typical Drivetrain Loss (%) | Expected WHP Retention |
|---|---|---|
| Front-Wheel Drive (FWD) | 10–12% | ~88–90% of BHP |
| Rear-Wheel Drive (RWD) | 11–13% | ~87–89% of BHP |
| All-Wheel Drive (AWD) | 15–20%+ | ~80–85% of BHP |
These ranges assume healthy, properly lubricated components. Neglect increases losses significantly. Check your engine servicing schedule to ensure fluids remain clean.
Dirty oil thickens under load, dragging down efficiency.
Use these baselines to evaluate modified builds. If your AWD car retains 95% of its BHP, the math likely includes estimation errors. Real-world physics demands respect for friction.
Don’t expect magic results without addressing mechanical resistance first.
Common Misinterpretations of BHP vs WHP Curves
Many enthusiasts mistake peak values for overall performance. A higher BHP peak does not guarantee faster lap times. The area under the curve matters more for sustained acceleration.
Narrow bands of power feel jerky and hard to control.
Another error involves comparing cars with different drivetrains directly. An FWD hot hatch might show similar WHP to a heavier RWD sedan. Yet the sedan may accelerate quicker due to better weight distribution.
Raw numbers lack context without vehicle mass data.
Also, beware of "dyno queens." Some shops tune specifically for ideal conditions. Cool air, fresh fuel, and perfect humidity boost readings temporarily. These figures rarely replicate street driving realities.
Always normalize data against standard atmospheric conditions before drawing conclusions.
Finally, ignore torque curves at low RPMs if focusing solely on top-end speed. Daily drivers benefit more from mid-range pull. Understanding where your power lives prevents buying unnecessary upgrades.
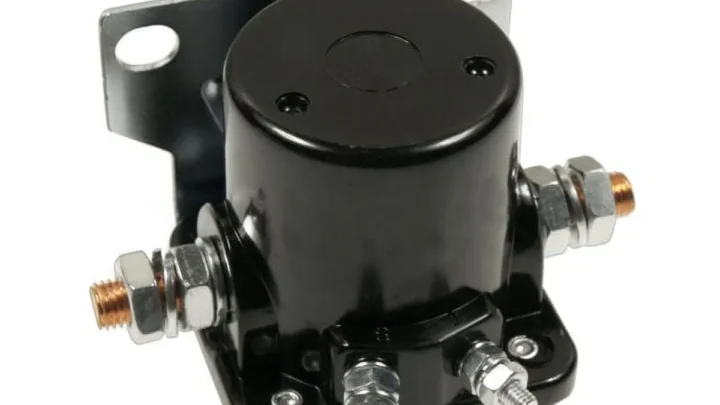
Look at signs of a bad starter if cranking struggles mask underlying electrical drain affecting sensor accuracy.
When to Prioritize One Metric Over the Other
Choose BHP when designing or rebuilding engines. Component stress limits depend on crankshaft output. Connecting rods and pistons care about rotational force at the source.
WHP is irrelevant for internal durability calculations.
Switch focus to WHP when optimizing exhaust or intake systems. These modifications aim to improve airflow efficiency. Success is measured by how much extra power reaches the wheels.
If BHP rises but WHP stays flat, losses increased elsewhere.
For drag racing, WHP is king. Elapsed time correlates directly with tire output. Aerodynamic drag fights against wheel power, not engine power.
Track days similarly demand attention to consistent WHP delivery over multiple laps.
Buyers verifying used sports cars should request recent dyno sheets. Compare claimed BHP against tested WHP using the loss tables above. Large deviations signal hidden problems.
Maybe the transmission slips or bearings bind. Catching this early saves costly repairs later. Refer to starter replacement cost guides if electrical faults complicate diagnostics further.
Verifying Claims with Standardized Testing Protocols
How do you know a dyno run is legit? Look for adherence to SAE J1349 standards. This protocol corrects raw data for ambient temperature, pressure, and humidity.
Without these adjustments, numbers fluctuate wildly based on weather. A cold morning test yields different results than a hot afternoon one.
Always check if the shop provides correction factors. Reputable facilities display both uncorrected and corrected values. Uncorrected data shows what happened in that specific moment.
Corrected data allows fair comparison across different days and locations. If a tuner hides the correction method, walk away immediately.
Manufacturer specifications also play a role here. Brands like Ford or BMW publish official power curves. Compare your dyno sheet against these baseline documents.
Significant deviations often point to aftermarket modifications or mechanical wear. Use parasitic draw diagnostics if electrical issues skew sensor readings during testing. Voltage drops can confuse modern engine management systems, leading to inaccurate fuel trims.
Remember that hub dynos measure differently than chassis rollers. Hub setups isolate wheel bearings but miss transmission losses. Chassis dynos capture the entire drivetrain experience.
Know which tool generated your data before trusting the final WHP figure. Consistency matters more than absolute perfection when tracking progress over time.
Frequently Asked Questions
Is BHP always higher than WHP?
Yes, almost universally. Brake horsepower measures output at the crankshaft. Wheel horsepower measures output at the tires.
Energy is lost as heat and friction through the transmission, driveshaft, and differential. Therefore, WHP will always be lower than BHP in any functional vehicle. The gap represents drivetrain efficiency losses.
Does turbo lag affect the BHP vs WHP difference?
Turbo lag impacts when peak power arrives, not necessarily the total loss percentage. However, boost leaks can reduce effective BHP generation. If the turbo system isn’t sealed properly, less air enters the cylinders.
This lowers combustion efficiency and reduces crank output. The resulting drop appears on both curves, maintaining the typical loss ratio unless severe damage exists.
Can I convert BHP to WHP using a simple formula?
No single formula works perfectly for every car. Drivetrain losses vary by gear selection, RPM, and component health. While 15% is a common rule of thumb for RWD vehicles, it’s an estimate.
Actual conversion requires physical testing on a dynamometer. Software calculators provide rough guesses but lack precision for tuning decisions. Always rely on measured data for critical applications.
Why do some cars show negative drivetrain losses?
This usually indicates measurement error or improper calibration. It’s physically impossible to gain power through friction. If WHP exceeds BHP, the sensors were likely misaligned.
Or perhaps the reference torque value was set incorrectly during setup. Another possibility is significant inertial effects masking true steady-state loads. Double-check all connections and recalibrate the equipment before accepting such anomalous results.
Do electric vehicles have BHP and WHP distinctions?
Electric motors are far more efficient than internal combustion engines. Losses occur primarily in inverters and gearboxes rather than complex multi-gear transmissions. Consequently, the gap between motor output and wheel output is smaller.
Typically, EVs lose only 2-5% of power compared to 10-20% in gas cars. Still, measuring at the wheels remains crucial for understanding real-world range and acceleration capabilities accurately.

Similar Posts